Estas cifras son una instantánea, no una previsión. Los ingresos de minería varían con el precio de la moneda, la dificultad de la red y la recompensa por bloque, y los tres cambian continuamente — la dificultad, en particular, históricamente solo ha tendido al alza, lo que alarga el punto de equilibrio más de lo que sugiere una proyección a tasa fija. Los halvings recortan la recompensa por bloque de golpe. Esta calculadora mantiene constante cada entrada, así que trata el resultado como «lo que pagarían las condiciones de hoy si nunca cambiaran», y sí cambiarán. No se modelan los contratos eléctricos, la refrigeración, los fallos de hardware, el tiempo de inactividad del pool ni el valor de reventa. Litecoin se minia conjuntamente con Dogecoin en la mayoría de los pools, lo que añade ingresos que esta calculadora no cuenta, así que una cifra de Litecoin aquí es un suelo, no el panorama completo. Nada de esto es asesoramiento financiero.
How this calculator works
Your share of a network is your hashrate divided by the total network hashrate. Multiply that share by the number of blocks found in a day and by the block reward, and you have your expected coin production. Multiply that by the coin price, subtract the pool fee, and you have gross revenue. Subtract electricity, and what is left is profit.
That is the whole model, and it is worth understanding because it makes the sensitivities obvious. Revenue scales linearly with coin price and inversely with network hashrate. Your power cost does not move at all. That asymmetry is why efficiency — joules per terahash — decides whether a machine survives a bear market, not raw hashrate.
Getting the inputs right
Power draw should be measured at the wall, not read off the spec sheet. Power supplies are not perfectly efficient and manufacturers quote the optimistic figure. If you have not measured it, add roughly ten per cent to the rated draw.
Coste eléctrico should be your marginal rate including delivery charges and taxes, not the headline generation rate. On many US residential tariffs the delivered cost is close to double the advertised one.
Network hashrate and block reward are pre-filled with recent approximations rather than live values. Check them against a block explorer before you rely on a result — difficulty moves roughly every two weeks on Bitcoin and the reward halves on a fixed schedule.
Why break-even is usually further out than you expect
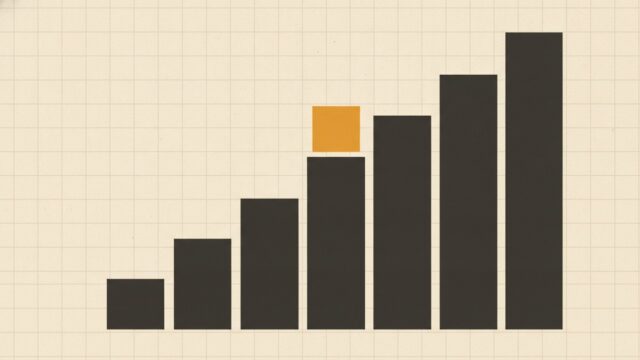
A flat projection assumes today’s difficulty forever. Historically network hashrate has trended upward, which means your share of the network shrinks over time even if your machine never slows down. A rig that shows a 400-day break-even at current difficulty will, in most historical periods, have taken meaningfully longer. Treat the number here as a best case.
Qué se movió realmente, qué significa para mineros y poseedores, y cualquier actualización de herramientas. Sin exageraciones, sin señales, sin colocaciones pagadas.
Nunca vendemos ni compartimos tu dirección. Cancela la suscripción con un clic.
Usamos una cookie para recordar tu elección de modo claro u oscuro, y ningún rastreador de terceros. Política de privacidad.